How to Get Real-Time Machine Data Without a 6-Month Integration Project
Traditional machine data integration projects take 4-6 months because they try to connect every system to every other system. The faster approach is read-only data collection through edge gateways that translate machine protocols into a common format without modifying the machine controllers. You can go from zero to first data point in days, not months.
1. Why Traditional Integration Projects Take So Long
A typical MES or SCADA integration project involves requirements gathering, protocol mapping, PLC programming changes, network architecture design, security review, testing, and validation. Each phase takes 3-6 weeks. The total timeline reaches 4-6 months, and that's before scope changes from production managers who realize what they actually need is different from what they requested.
The traditional path to machine data goes like this. A plant decides they need production visibility. They buy an MES platform. The MES integrator sends a team to document every machine, every PLC register, and every data point they want to collect. That documentation phase alone takes 3-4 weeks for a plant with 50+ machines.
Next, the integrator develops custom PLC code for each machine to expose the required data points. For modern machines with OPC-UA servers already configured, this is relatively fast. For older machines running legacy Mitsubishi or Allen-Bradley PLCs from the early 2000s, it requires programming time on each machine's controller. Many plants don't even have the PLC source code for their older machines, which means the integrator is reverse-engineering register maps.
Then comes the network architecture. The integrator needs to connect machines on the plant floor network to the MES server without compromising the OT network's security or stability. This involves firewalls, VLANs, and approval from both the OT engineering team and the IT security team. In heavily regulated industries, the security review alone can take 4-6 weeks.
Finally, testing. Every data point needs validation: does the MES display match the HMI? Do cycle counts reconcile? Are timestamps synchronized? Testing across 50 machines with varying protocols takes 2-4 weeks.
The total cost for this type of project runs $150,000-500,000 for a mid-size plant [1]. Plants accept this timeline and cost because they assume it's the only way. It isn't.
The alternative is to collect machine data passively, without modifying PLC programs, without introducing new network connections between OT and IT, and without a 6-month project timeline.
2. Protocol Primer: OPC-UA, MQTT, Modbus, and What They Mean for You
Your machines speak different languages. OPC-UA is the modern standard with built-in discovery and security. MQTT is lightweight and ideal for sensor networks. Modbus is the 40-year-old workhorse still running on most legacy equipment. Understanding which protocols your equipment supports determines your data collection strategy.
You don't need to become a protocol expert, but understanding the basics will save you from overpaying for integration work and from buying equipment that doesn't talk to your machines.
OPC-UA (Open Platform Communications Unified Architecture): the modern industrial standard. Machines manufactured after 2015 increasingly come with OPC-UA servers built in. The protocol includes device discovery (the gateway can automatically find what data points are available), security (encrypted connections, authentication), and structured data (the machine describes its own data model). If your machines support OPC-UA, data collection is relatively straightforward. An edge gateway connects as a client, browses the available data points, and starts reading values. No PLC programming changes required.
MQTT (Message Queuing Telemetry Transport): a lightweight publish/subscribe protocol originally designed for remote telemetry. It's the default for most IoT sensors and is increasingly used by newer PLCs and HMIs. MQTT is efficient on bandwidth (important for wireless sensor networks), supports quality-of-service levels (guaranteed delivery for critical data), and works well through firewalls because the connection is outbound from the machine.
Modbus (RTU and TCP): the protocol you'll find on most equipment over 10 years old. Modbus is simple, well-documented, and supported by essentially every PLC ever made. The downside is that Modbus has no built-in data model. You need to know which register address holds which value, and that information lives in the machine's documentation (if you have it) or in the PLC program (if you have access). Reading Modbus data requires a register map, but once you have it, the actual data collection is fast.
EtherNet/IP and Profinet: the two dominant industrial Ethernet protocols, used primarily by Allen-Bradley (EtherNet/IP) and Siemens (Profinet) equipment. These are real-time industrial protocols optimized for control, not monitoring. You generally don't connect a monitoring platform directly to these networks. Instead, the PLC exposes data through an OPC-UA server or Modbus TCP gateway [2].
The practical question for your plant: for each machine, what protocol does it support, and where is the documentation? Walk the floor with your controls engineer and catalog this. It takes a day. That catalog determines your data collection architecture.
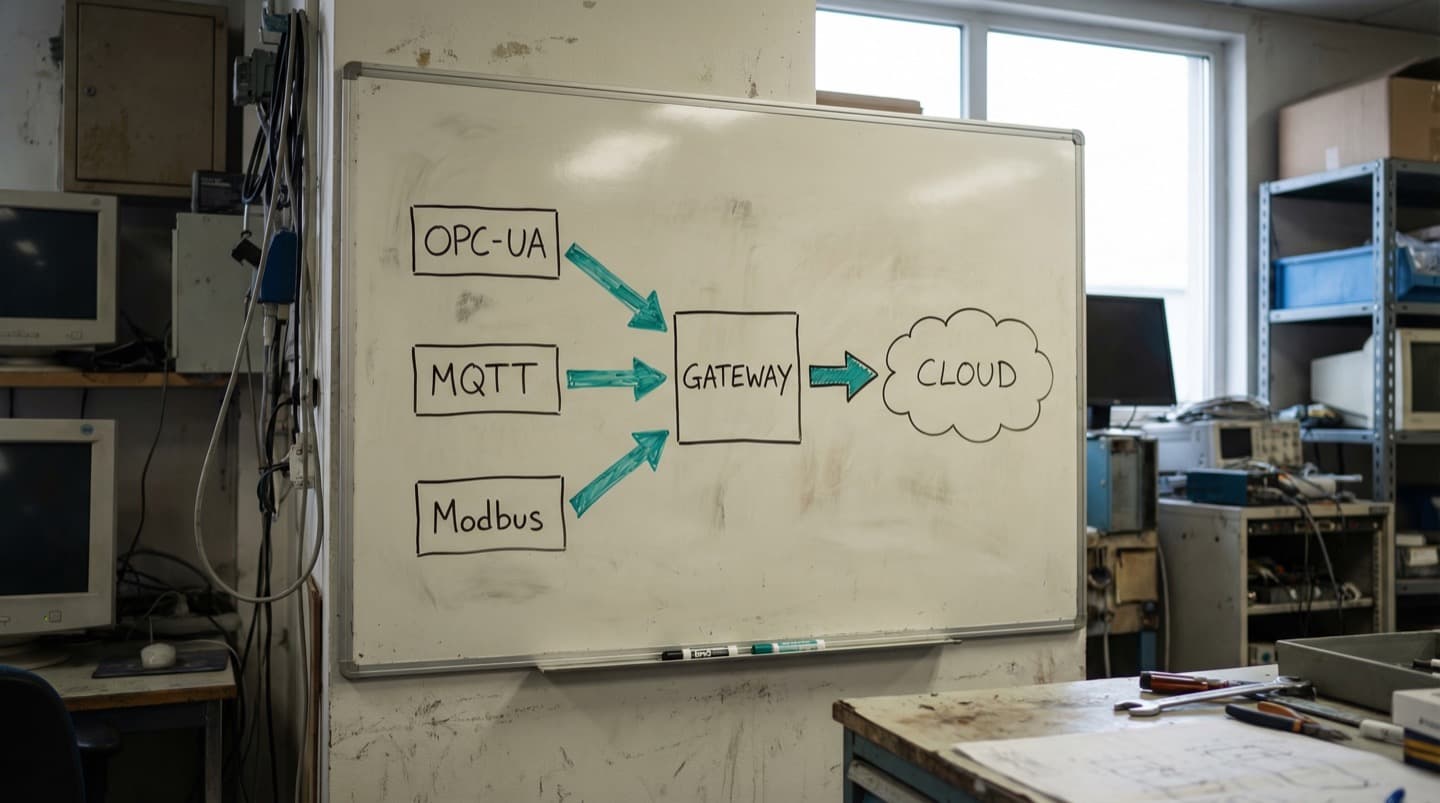
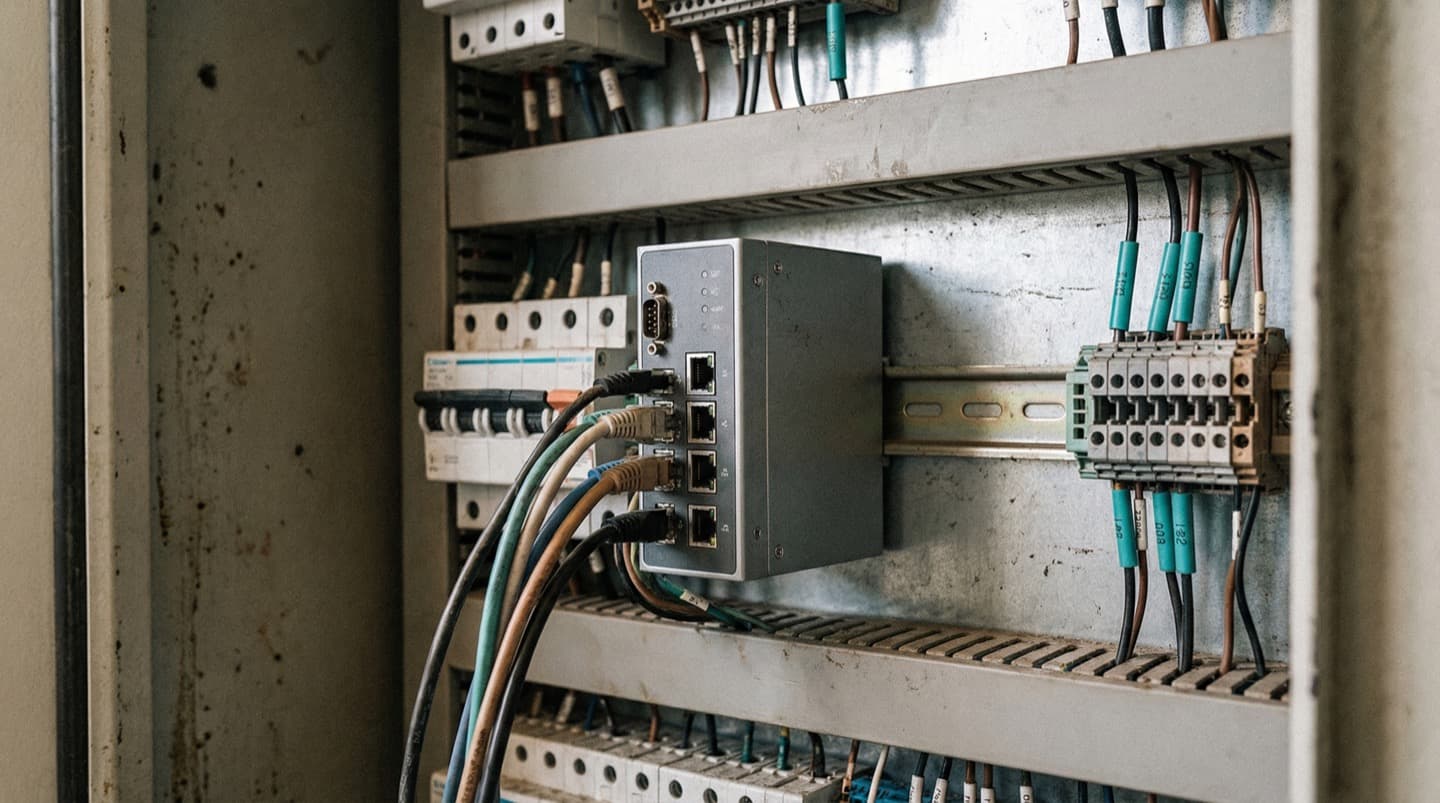
3. Edge Gateways: The Bridge Between Old Equipment and Modern Platforms
An edge gateway is a small industrial computer that sits on the factory floor, connects to machines using their native protocols, translates the data into a common format, and sends it to your monitoring platform. It costs $200-1,500, installs in hours, and doesn't require any changes to the machine's PLC program.
Think of an edge gateway as a universal translator. On one side, it speaks Modbus to your 2004-era packaging machine. On another port, it speaks OPC-UA to your 2019 CNC. On a third interface, it receives MQTT messages from wireless vibration sensors. On its output, it sends all of this data in a unified format to your cloud platform or on-premise server.
The physical hardware ranges from single-board computers running Linux ($200-400 for basic data collection from 5-15 machines) to purpose-built industrial IoT gateways ($800-1,500 with DIN-rail mounting, industrial temperature rating, and redundant communications).
What an edge gateway does:
- Connects to machines using their native protocol. For OPC-UA machines, this means browsing the server and selecting data points. For Modbus machines, this means reading specific register addresses based on the register map. No PLC programming changes on either side.
- Normalizes the data. Different machines report temperature in Celsius or Fahrenheit, speeds in RPM or mm/sec, states as integers or strings. The gateway maps everything to a consistent schema.
- Buffers data locally. If the network connection to the cloud platform drops, the gateway stores data locally and forwards it when the connection resumes. This means you don't lose data during network outages.
- Runs local computation. The gateway can calculate running averages, check thresholds, and trigger local alerts without round-tripping to the cloud. This reduces latency for time-sensitive alerts to under 1 second.
Installation is non-invasive. The gateway connects to the machine network as a passive reader. It doesn't inject commands, modify PLC registers, or interfere with machine operation. If the gateway fails or loses power, the machine doesn't notice.
A single gateway typically handles 10-50 machines depending on polling frequency and the number of data points per machine. For a small plant, one or two gateways cover the entire operation. For a large plant, you might deploy one gateway per production cell or per building zone [3].
The deployment timeline for an edge gateway is measured in hours, not months. Physically mounting and powering the unit takes 30 minutes. Configuring the machine connections takes 1-4 hours depending on how many protocols are involved. The limiting factor is usually obtaining the Modbus register maps for legacy equipment, which is a documentation exercise, not a programming exercise.
4. Retrofitting Sensors on Equipment with No Digital Output
Some machines predate digital communication entirely. Hydraulic presses from the 1980s, manual lathes with analog gauges, legacy conveyor systems with relay-based controls. These machines won't talk Modbus or OPC-UA, but you can still get data from them using clamp-on sensors that measure the physics directly without touching the machine's control system.
Not every machine has a PLC, and not every PLC has data worth reading. When you encounter equipment that can't be connected digitally, the approach shifts from protocol-based data collection to physics-based measurement.
Clamp-on current transformers: wrap around the machine's power cable without disconnecting anything. They measure current draw, which tells you whether the machine is running, idle, or off. More detailed analysis of the current waveform can reveal cycle counts, load variations, and even some fault conditions. Cost: $50-200 per machine. Installation time: 5 minutes. No electrical work required.
Wireless vibration sensors: mount on the outside of bearing housings, motor casings, or gearbox surfaces using magnetic mounts or adhesive. They measure acceleration and velocity, which provides bearing health, imbalance, and misalignment data. Cost: $200-500 per sensor point. Installation: peel-and-stick or magnet.
Non-contact temperature sensors: infrared sensors aimed at motor surfaces, hydraulic lines, or electrical connections. They measure surface temperature without physical contact, which is important for monitoring equipment where mounting a contact thermocouple isn't practical (rotating parts, high-voltage components). Cost: $100-300 per point.
Photoelectric cycle counters: a simple beam-break sensor positioned at the machine output. Every time a part passes through, the counter increments. For machines with no digital output, this is the easiest way to get production count data. Cost: $50-150. Installation: mount the sensor bracket at the discharge point.
Acoustic emission sensors: detect the sound signature of mechanical events like tool breakage, material cracking, or bearing spalling. More specialized than vibration sensors, they're useful on equipment where physical contact mounting isn't practical. Cost: $300-800 per point.
All of these retrofit sensors connect wirelessly to an edge gateway, so there's no need to run cables back to a control panel. The gateway aggregates the data alongside whatever digital machine data you're collecting from connected equipment.
The practical rule: if a machine contributes to your top 10 downtime causes [4] and has no digital interface, a $500-1,000 retrofit sensor package will get you 80% of the monitoring value that a fully instrumented machine provides.
5. The Read-Only Approach to Machine Connectivity
The fastest, safest, and least disruptive way to get machine data is to read it without writing anything back. Edge gateways read PLC registers, sensors measure physical parameters, and current transformers monitor power consumption. None of these methods modify machine behavior, inject commands, or create control dependencies. If the monitoring system fails, the machines don't care.
The biggest objection to machine data collection isn't cost or technology. It's risk. Production managers and controls engineers have a reasonable fear: connecting new systems to machines might interfere with production. A misconfigured data request could overload a PLC's communication buffer. A rogue command from a monitoring platform could change a setpoint. A network conflict could disrupt the real-time control loop.
The read-only approach eliminates these risks by design.
At the protocol level, edge gateways are configured as read-only clients. They send data requests (read register X) but never write commands (set register X to value Y). Most industrial protocols support read-only access modes natively. OPC-UA has role-based access control where the gateway can be restricted to read-only permissions. Modbus gateways can be configured to use only function codes 03 (read holding registers) and 04 (read input registers), never function codes 06 or 16 (write).
At the network level, the monitoring system operates on a separate network segment. Machine traffic stays on the OT network. Monitoring data exits through the edge gateway on a separate interface. There's no bridge between the monitoring platform and the machine control network.
At the physical level, retrofit sensors (current transformers, vibration sensors, temperature sensors) are non-invasive. They measure from outside the machine. A clamp-on CT wraps around a power cable without breaking the circuit. A vibration sensor sits on the bearing housing exterior. Nothing is wired into the machine's control system.
This read-only architecture means the monitoring system is additive. It provides data without creating dependencies. If the gateway fails, the machine continues running normally. If the cloud platform goes offline, the gateway buffers data locally and the machine is unaffected.
The tradeoff is that read-only access limits what you can do with the data. You can monitor, alert, and analyze, but you can't close the loop and automatically adjust machine parameters based on the data. For plants that want closed-loop control, that's a later-stage capability that requires deeper integration. But for the first phase of getting visibility into machine performance, read-only is faster, safer, and sufficient [5].
6. Going from First Data Point to Full Plant Coverage
The path from first sensor to full plant coverage follows a predictable ramp. Start with one machine or one line, prove the value, and expand. Most plants reach useful coverage of their critical equipment in 4-8 weeks and full plant coverage in 3-6 months.
Day 1-3: Pick your first machine. Choose the one that appears most often in your downtime log or the one your production manager complains about most. Install an edge gateway, connect to whatever data the machine offers (OPC-UA, Modbus, or retrofit sensors if needed), and get data flowing to a dashboard.
Day 4-7: Validate and tune. Check that the data matches physical reality. Is the reported speed consistent with manual observations? Do the cycle counts match the paper log? Adjust polling rates and data mappings. This validation step is important because garbage data is worse than no data.
Week 2-3: Expand to the first line. Connect the remaining machines on the same production line to the gateway. Most gateways handle 10-50 connections, so one device often covers an entire line. Start building the composite view: line OEE, throughput tracking, and cross-machine event correlation.
Week 4-6: Connect the second and third lines. By now, you have a playbook: which protocols each machine type uses, how long each connection takes, and what data points are worth collecting. The per-machine connection time drops from 2-4 hours on the first machine to 30-60 minutes on subsequent machines of the same type.
Month 2-3: Address legacy equipment. The machines with no digital interface get retrofit sensors. Current transformers for run/stop detection, vibration sensors for health monitoring, cycle counters for production tracking. These take longer per machine because the sensor mounting is physical work, but the value per data point is often higher because these machines had zero visibility before.
Month 3-6: Optimize and automate. With data flowing from most of the plant, shift focus from data collection to data use. Which alerts are actionable? Which trends predict failures? Where are the cross-machine patterns? This is where the monitoring system transitions from a data collection project to an operational tool.
What matters most isn't technology. It's momentum. Plants that install the first gateway and then spend 2 months in a committee review before expanding lose the urgency. Plants that set a pace of 2-3 new machine connections per week build coverage quickly and demonstrate value continuously.
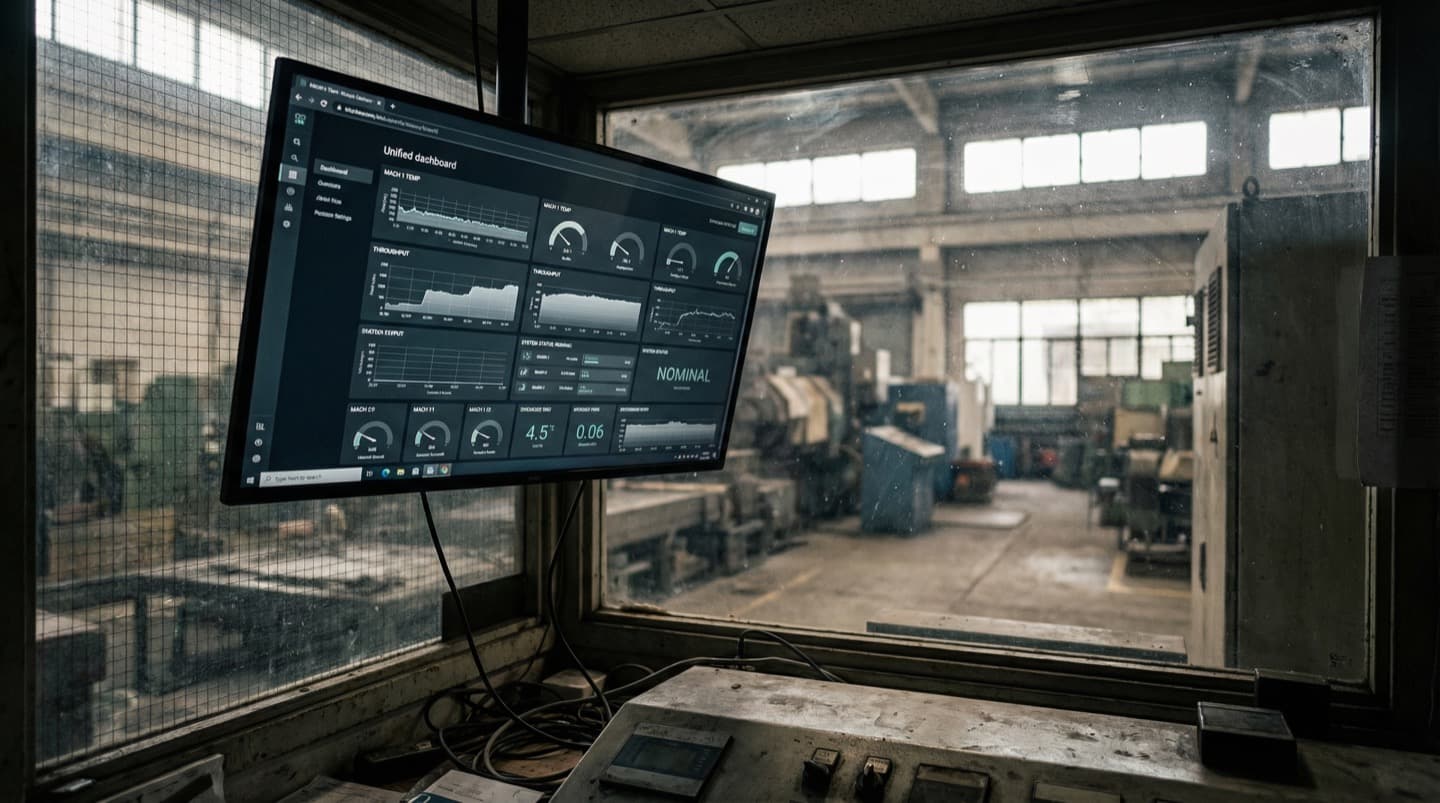
From Data Collection to Spatial Intelligence
Once machine data is flowing, the next step is giving it spatial context. Digital twin platforms place every machine data stream on a floor plan model, making it possible to see how machine performance relates to physical proximity, shared utilities, and environmental conditions.
Collecting machine data solves the visibility problem: you can see what each machine is doing. But machines don't operate in isolation. They share power feeds, compressed air lines, cooling water, and environmental conditions. When machine performance degrades, the cause is sometimes the machine itself and sometimes the infrastructure around it.
Digital twin platforms address this by anchoring machine data to physical location. When five machines in the same area all show a 3% throughput dip at 2 PM, the spatial view instantly raises the question: what changed in that area at 2 PM? The time-series charts from each machine would show five independent performance dips. The spatial view shows a correlated cluster with a shared geographic cause.
The practical deployment path looks like this: once you have edge gateways collecting data from your critical equipment, import your facility floor plan into a digital twin platform. Map each machine to its physical location. The platform overlays the live data streams onto the floor plan, creating a spatial view that updates continuously.
This spatial context also accelerates troubleshooting when something goes wrong. Instead of checking a list of alarm codes and then walking the plant to figure out what's near the troubled machine, a technician pulls up the floor plan view and immediately sees the spatial context: neighboring machines' status, utility conditions in that zone, and environmental readings nearby.
The deployment overhead is minimal if the data collection infrastructure (edge gateways, sensor network) is already in place. The digital twin platform consumes the same data streams that are already feeding your dashboards. It adds the spatial dimension without requiring new hardware or new machine connections.
FAQ
Frequently Asked Questions
Related Resources
Manufacturing Downtime Cost Calculator
Calculate the true cost of unplanned downtime across your production lines. Includes lost revenue, labor waste, and scrap costs. Free, instant results.
Learn moreDigital Twin vs SCADA
A practical comparison of SCADA and digital twin platforms for manufacturing. Covers data models, visualization, alerting, and deployment trade-offs.
Learn moreDigital Twin vs Dashboards
How industrial dashboards and digital twins compare on data visualization, troubleshooting, and cross-system monitoring. Covers Grafana, Power BI, and spatial alternatives.
Learn moreDigital Twin vs MES
A practical comparison of MES and digital twin platforms for manufacturing. Covers ISA-95 levels, OEE tracking, production traceability, and how the two systems complement each other.
Learn moreUnplanned Downtime Prevention
Most manufacturers discover downtime after it costs them. Sandhed gives you the visibility to catch equipment issues before they shut down production.
Learn moreMaintenance Management
Maintenance teams lose hours tracking down service records, chasing overdue tasks, and figuring out what was done last time. Sandhed puts every work order, service record, and maintenance schedule on your 3D floor plan where you can see it.
Learn moreHow to Monitor a Factory Floor in Real Time
Real-time factory monitoring means having sensor data from machines, environment, and process parameters available within seconds, not hours. It starts with choosing the right sensors for your top failure modes, runs through an edge-to-cloud architecture that handles the data volume, and works only if the alert design respects your operators' attention.
Learn moreHow to Reduce Equipment Downtime: 8 Strategies Ranked by Impact
Reducing equipment downtime starts with knowing where you're losing time, not with buying technology. The eight strategies below are ranked by how much downtime they typically eliminate in the first year. The top three are organizational fixes that cost almost nothing. The rest require incremental investment but build on each other.
Learn moreGet Your First Machine Data Flowing This Week
See how read-only edge gateways connect to your equipment without PLC changes. Walk through a setup with your actual machine list.