How to Reduce Equipment Downtime: 8 Strategies Ranked by Impact
Reducing equipment downtime starts with knowing where you're losing time, not with buying technology. The eight strategies below are ranked by how much downtime they typically eliminate in the first year. The top three are organizational fixes that cost almost nothing. The rest require incremental investment but build on each other.
1. Start with Your Downtime Pareto
Before investing in any solution, pull your downtime data for the last 6-12 months and build a Pareto chart. In most plants, 3-5 root causes account for 60-80% of total lost production time [1]. Fixing those 3-5 causes gives you the majority of your improvement without touching the long tail.
This is strategy number one for a reason. Every other strategy in this article assumes you know where your downtime is concentrated. Without a Pareto, you're guessing.
Pull data from two sources: your CMMS (maintenance work orders) and your production system (line stop events). The CMMS tells you what the maintenance team was called to fix. The production system tells you how long the line was actually down. These numbers often don't match because the CMMS captures repair time, not total downtime including response delay and restart.
Categorize each event by root cause, not by symptom. "Conveyor drive fault" is a symptom. "Bearing failure on conveyor gearbox" is a root cause. "Motor overtemperature" is a symptom. "Blocked ventilation filter on motor enclosure" is a root cause. Getting to root cause takes more effort but makes the Pareto actionable.
Sort by total minutes lost, not by number of events. One catastrophic 8-hour failure outweighs fifty 5-minute nuisance stops in terms of total production impact, but the nuisance stops often get more attention because they're annoying and frequent.
A clean Pareto typically reveals that your plant has two categories of downtime problem: a few chronic issues that consume most of the total time, and a long tail of infrequent events that individually don't matter much. Focus your first improvement cycle entirely on the chronic issues. The long tail can wait.
If you don't have good data, start collecting it now. A shared spreadsheet where operators log every stop event with timestamp, duration, machine, and suspected cause will produce a usable Pareto in 30-60 days.
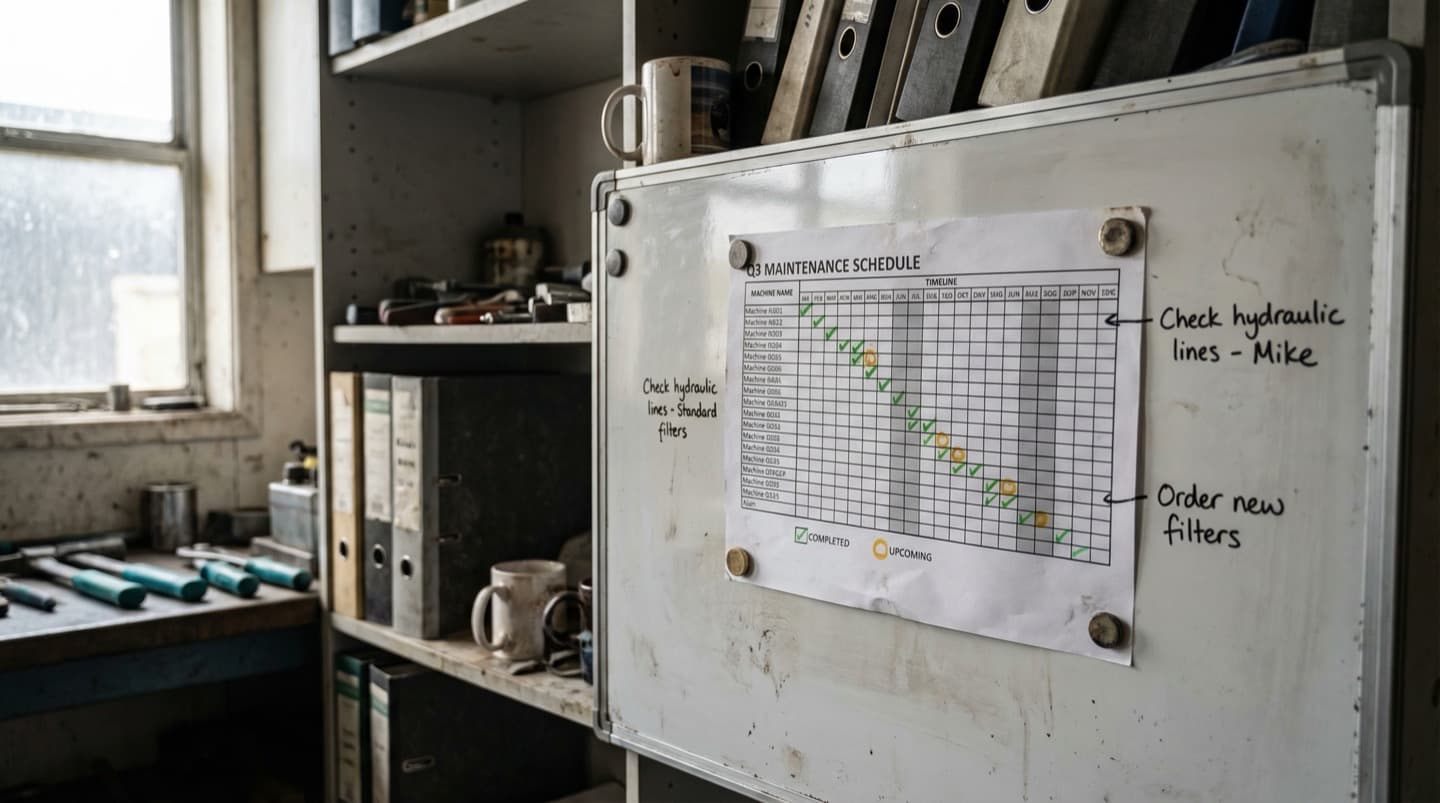
2. Fix Your Preventive Maintenance Schedule
The median PM completion rate in manufacturing is 78% [2]. That means roughly one in five scheduled maintenance tasks doesn't happen on time. Many of those missed PMs directly precede the failures that show up in your downtime Pareto. Before adding predictive technology, get the basics right.
Preventive maintenance is not glamorous. It's the blocking and tackling of reliability. And most plants are doing it at 78% completion, which means they're skipping 22% of scheduled tasks.
The missed PMs cluster predictably. Tasks on nights and weekends get skipped because staffing is thin. Tasks that require a production stop get deferred because nobody wants to lose output for planned maintenance. Tasks with long intervals (quarterly, semi-annual) fall off the radar because the due date seems far away until it's past.
Pull your PM completion report by machine, by task, and by time period. Look for patterns:
- Which machines have the lowest PM completion rates? Compare those to your downtime Pareto. Odds are good that machines with poor PM compliance are overrepresented in your top downtime contributors.
- Which specific PM tasks get skipped most often? If the monthly gearbox oil sample keeps getting deferred, and gearbox failures are in your top 5, the connection is direct.
- What time periods have the lowest completion? If PM compliance drops to 60% during summer shutdown recovery or peak production seasons, that's when your next failures are being planted.
The fix is usually operational, not technological. Protect PM time on the production schedule the same way you protect production orders. If a PM requires 2 hours of downtime on Line 3, schedule it like a production run. Make it visible on the production board. Hold the production planner accountable for providing the window.
For tasks that don't require a production stop (checking belt tension, topping off lubricant reservoirs, inspecting guard condition), bundle them into operator rounds rather than relying on maintenance technicians. Operators are at the machine every shift. If they can do a 5-minute walk-around check, it frees the maintenance team for tasks that actually require technical skill.
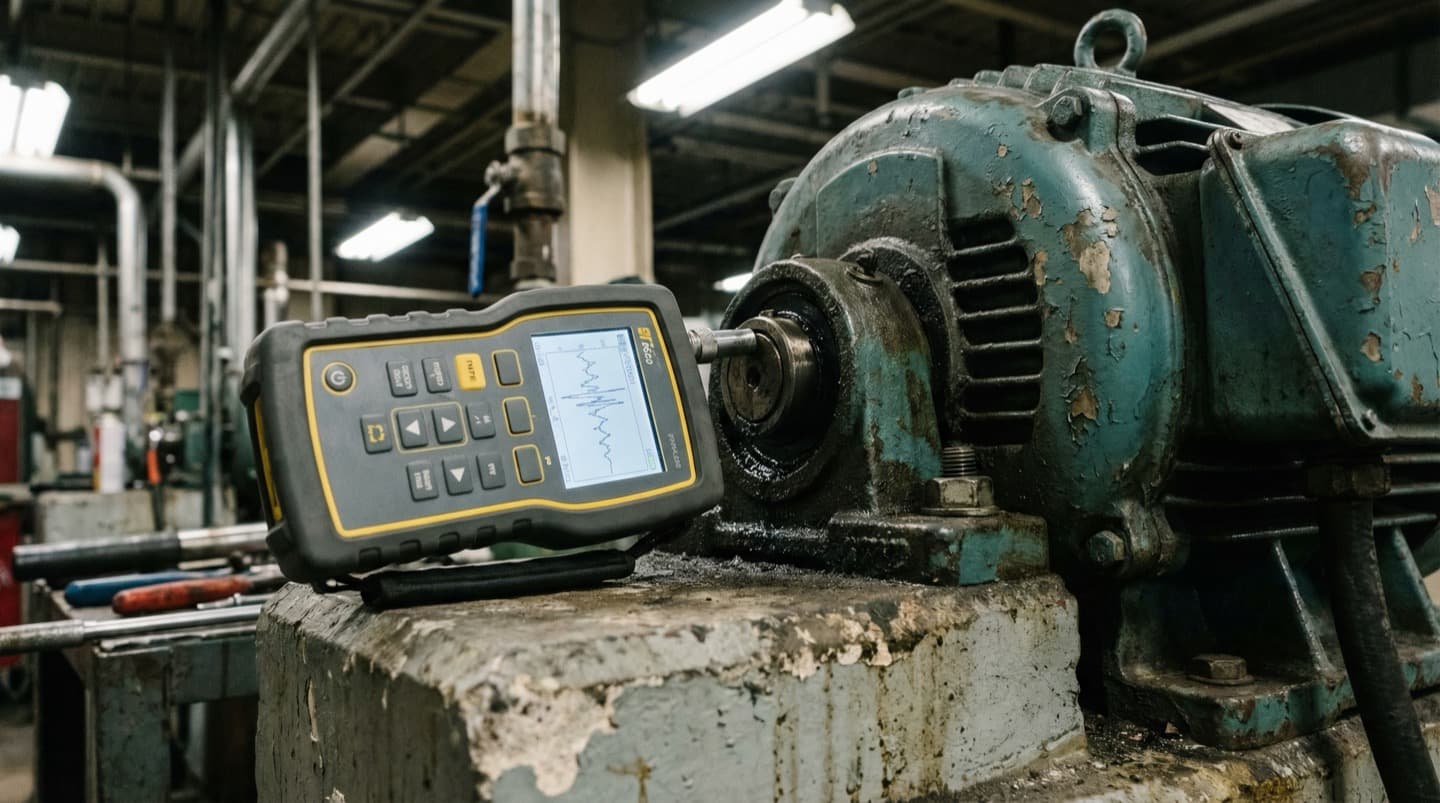
3. Vibration Monitoring on Critical Rotating Equipment
Vibration monitoring on bearings, gearboxes, and motor shafts catches 80% of rotating equipment failures 2-8 weeks before they occur. Wireless vibration sensors cost $200-500 per point. For the top 10 machines in your downtime Pareto, the investment pays back in one prevented failure.
Rotating equipment fails in predictable ways: bearing wear, imbalance, misalignment, looseness. All of these failure modes produce characteristic vibration signatures that change weeks before the failure becomes critical.
A bearing in early-stage degradation produces high-frequency vibration at specific frequencies related to the bearing geometry (ball pass frequency, cage rotation frequency). These frequencies are invisible to a human standing next to the machine but obvious to an accelerometer sampling at 10-25 kHz.
The practical approach:
- Identify your top 10-15 rotating equipment assets by downtime impact.
- Install one wireless vibration sensor per critical bearing housing. For a motor-gearbox-driven conveyor, that's typically 4 points: motor drive end, motor non-drive end, gearbox input bearing, gearbox output bearing.
- Set baseline vibration levels during the first 2-4 weeks of operation.
- Configure alerts for when overall vibration exceeds 2x baseline, or when specific frequency bands associated with bearing defects increase.
Wireless vibration sensors from established manufacturers run $200-500 per point for the sensor, with gateway and software costs of $2,000-5,000 for a 10-20 sensor deployment. Battery life is 2-5 years with typical sampling intervals.
The value calculation is straightforward. If a single unplanned gearbox failure costs $15,000 in parts, labor, and lost production (a conservative estimate for most discrete manufacturing), and vibration monitoring prevents one failure per year, the 20-sensor deployment pays for itself in the first incident.
Vibration monitoring has the highest signal-to-noise ratio of any predictive technology for rotating equipment. Unlike thermal or current monitoring, vibration data gives you both the severity of the problem and the specific failure mode (bearing defect, imbalance, misalignment), which tells the maintenance team what parts to order and what repair to plan [3].
4. Thermal Imaging for Electrical Panels
Loose electrical connections in panels cause 25% of electrical fires in industrial facilities and an outsized share of drive and control faults. A quarterly thermal scan of every electrical panel takes one technician 2-4 hours and routinely finds 5-15 hot connections per plant that would eventually fail.
Electrical connections loosen over time due to thermal cycling, vibration, and copper creep. A loose connection has higher resistance. Higher resistance generates heat. The connection gets hotter, expands, loosens further, and the cycle accelerates until it either trips a breaker or causes an arc flash.
The problem is that you can't see a loose connection by looking at it. The panel looks fine. The circuit works fine. But the connection is running at 130 degrees C instead of 40 degrees C, and it's slowly cooking the insulation on the adjacent wires.
Thermal imaging cameras (starting at $300 for a smartphone attachment, $2,000-5,000 for a dedicated handheld unit) make hot connections immediately visible. A quarterly scan of every panel in the plant catches problems that are months away from failure.
What a thermal scan program looks like:
- Scan every main distribution panel, MCC bucket, and VFD enclosure quarterly. More often for panels over 10 years old.
- Scan with panels closed but energized and under load. A loose connection that's cool at idle will be hot under full current.
- Flag any connection running more than 15 degrees C above its neighbors. Connections more than 40 degrees C above ambient need attention within a week. Connections over 70 degrees C above ambient need immediate de-energization and repair.
- Take a baseline image of each panel when connections are confirmed tight. Use this baseline for comparison on subsequent scans.
The labor cost of quarterly scans is minimal: 2-4 hours per plant for an electrician with a thermal camera. The alternative is waiting for the connection to fail during production, which means an unplanned electrical outage, potential drive or PLC damage, and the safety risk of working on a panel that's already been thermally stressed.
Some plants go further and install permanent thermal monitoring on their most critical panels (main incoming, largest MCC sections). Fixed thermal sensors cost $50-100 per point and provide continuous data instead of quarterly snapshots.
5. Spare Parts Stocking Strategy
40% of downtime events last longer than necessary because the required part isn't in stock [4]. A risk-based stocking strategy that prioritizes parts for your top downtime contributors and long-lead-time items can cut mean time to repair by 25-35% without increasing total inventory value.
When a critical machine goes down, the repair clock starts. If the tech can diagnose the fault in 15 minutes and the spare part is on the shelf, the total downtime might be 45 minutes. If the same part needs to be ordered from a distributor, you're adding 4 hours to 3 days depending on availability and shipping.
Most plants stock spare parts based on one of two approaches, both flawed:
- Stock everything the OEM recommends. This ties up capital in slow-moving parts while missing non-OEM components (bearings, seals, belts) that fail more frequently.
- Stock nothing and order on demand. This minimizes inventory cost but maximizes downtime because every repair becomes an expediting exercise.
A risk-based approach matches stocking levels to criticality and lead time:
- For your top 10 downtime-causing machines, stock every wear component that has a lead time over 24 hours. This includes bearings, seals, belts, motor drives, contactors, proximity sensors, and solenoid valves.
- For machines outside the top 10, stock only items with lead times over 1 week (motors, specialty PLCs, custom machined parts).
- For commodity items available from local distributors within 4 hours (standard bearings, common electrical components), don't stock them. Set up vendor agreements with guaranteed same-day delivery.
Review stock levels quarterly against actual consumption. Parts that haven't been used in 2 years should be evaluated for removal. Parts that have been emergency-ordered twice in the last year should be added to stock.
One frequently overlooked improvement: stage commonly needed parts at the machine instead of in a central storeroom. If Line 3's packaging machine blows a proximity sensor every 3-4 months, keep two spares in a cabinet at the machine. The tech saves 10 minutes of walking to the crib, checking out the part, and walking back. Over a year, those saved minutes add up across every repair event.
6. Predictive Maintenance: When It Makes Sense
Predictive maintenance (condition-based monitoring that forecasts failures) delivers significant value, but only on equipment where the failure mode is gradual, detectable, and the cost of failure is high. Applying predictive techniques to every machine in the plant is wasteful. Apply them selectively to the top 15-20% of critical assets.
Predictive maintenance is not a replacement for preventive maintenance. It's an addition to it. Plants that skip the PM fundamentals and jump straight to predictive technology end up with sensors generating alerts that no one has time to act on.
Predictive maintenance makes economic sense when all three conditions are met:
- The failure mode develops gradually (days to weeks, not seconds). Bearing wear, insulation degradation, and filter fouling are gradual. Electrical short circuits and control software bugs are not.
- The failure mode produces a detectable physical signal. Vibration, temperature rise, current draw increase, pressure differential change, or oil contamination are all measurable precursors. Some failure modes (random electrical faults, lightning-induced surges) don't have precursors.
- The cost of unplanned failure significantly exceeds the cost of planned replacement. If a failure shuts down a $50,000/hour production line for 4 hours, the $200,000 avoided-cost justifies a $5,000 annual monitoring investment easily. If a failure stops a $500/hour auxiliary process for 30 minutes, the $250 avoided-cost doesn't justify the same investment.
For most plants, the predictive maintenance sweet spot covers 15-20% of total assets but 60-70% of total downtime risk. These are the critical rotating equipment, the large drives, the complex hydraulic systems, and the high-value tooling.
The remaining 80% of assets are better served by good preventive maintenance (time or cycle-based replacement of wear items) and reactive maintenance (run to failure, then fix). Yes, running some things to failure is a valid strategy, as long as the failure doesn't cascade to other equipment and the repair time is acceptable.
Start predictive maintenance on your top 5 downtime assets. Measure the results for 6 months. Then expand to the next 5. This incremental approach lets your maintenance team build skill with the technology and demonstrates ROI before you commit to a plant-wide deployment.
7. Operator-Driven Reliability
Operators run the machine every shift. They notice changes in sound, vibration feel, and product quality before any sensor does. An operator-driven reliability program turns those observations into early warnings by giving operators a structured way to report conditions and a guarantee that their reports get acted on.
The best sensor on your factory floor is the operator standing in front of the machine. They hear the gearbox change pitch. They feel the increased vibration through the floor. They notice that the product quality shifts slightly right after lunch. These observations are enormously valuable, but most plants have no systematic way to capture them.
Operator-driven reliability (ODR) programs formalize what good operators already do informally. The structure is straightforward:
- Daily operator walk-around checklist: 5-10 items that the operator inspects at the start of each shift. Not a 50-item checklist that nobody completes. Five things that matter: listen for unusual sounds, check for visible leaks, verify guard condition, note any product quality changes, check lubricant levels on sight glasses. Takes 5 minutes.
- Abnormality reporting mechanism: a simple way for operators to report something that doesn't seem right, even if it hasn't caused a failure yet. "Gearbox on station 4 sounds different today" is a valid report. The best plants use a tag system where the operator places a physical tag on the machine and enters a one-line description on a tablet or paper form.
- Guaranteed follow-up: this is where most ODR programs fail. Operators report conditions, nothing happens, and they stop reporting. Every operator report needs a response within 24 hours, even if the response is "we checked it and it's within normal range." When operators see that their observations lead to action, reporting frequency increases dramatically.
Plants with mature ODR programs catch 15-20% of equipment issues through operator observation before any automated system detects them [5]. The cost of the program is essentially zero beyond the initial training and the discipline to follow up on reports.
The hardest part is cultural. In many plants, operators are expected to run the machine and call maintenance when it breaks. Asking them to participate in reliability requires a shift in expectations and visible support from both operations and maintenance leadership.
8. Connecting Maintenance Data to Spatial Context
Maintenance data in a CMMS exists as a list: work order 4521, machine CNC-07, bearing replacement, 3.5 hours. What the list doesn't show is that CNC-07 sits next to a cooling water manifold that has been leaking intermittently, in a zone where three other machines have had bearing failures in the past 6 months. Spatial context turns isolated events into patterns.
Your CMMS contains years of maintenance history, but it's organized by machine, not by location. This means spatial patterns are invisible. You'd never think to correlate bearing failures on CNC-07, CNC-09, and CNC-11 unless someone noticed that they're all in the same row, all fed by the same coolant loop, and all experiencing the same contaminated coolant issue.
Mapping maintenance events onto the physical plant layout reveals clusters:
- Geographic failure clusters: multiple machines in the same area experiencing similar failures. This often points to an environmental cause (vibration from a nearby press, temperature excursions from inadequate HVAC, contaminated utilities from a shared supply line).
- Maintenance traffic patterns: plotting where technicians spend their time on a floor plan shows you which areas of the plant consume the most maintenance resources. This is often different from what the downtime Pareto shows because it includes all the small repairs and adjustments that don't individually register as downtime events.
- Failure migration: a bearing failure on machine A that was "fixed" but actually transferred the root cause (misalignment, foundation issue) to machine B, which fails three months later. On a flat work order list, these look unrelated. On a floor plan, the spatial proximity is obvious.
The practical way to start: export your CMMS work orders for the last 12 months with machine location data. Plot them on a floor plan using color coding for failure type (mechanical, electrical, pneumatic, hydraulic). Look for clusters. Most plants find at least two geographic clusters that weren't visible in the tabular CMMS data.
This spatial analysis doesn't require specialized software for a first pass. A printed floor plan and colored pushpins works. But sustaining it over time benefits from a digital platform that automatically maps new work orders to physical locations and updates the spatial view continuously.

Why Spatial Context Changes the Maintenance Game
The most effective maintenance teams are moving from list-based CMMS views to spatial digital twin views where every work order, every sensor alert, and every failure event is pinned to its physical location. This shift makes pattern recognition automatic instead of relying on the institutional knowledge of long-tenured technicians.
Traditional maintenance management is organized around assets. You look up a machine, see its work order history, check its PM schedule, review its spare parts list. This asset-centric view works well for individual machine reliability but misses the system-level patterns that drive a large share of chronic downtime.
Digital twin platforms reorganize this data around space. Every asset occupies a physical location. Every maintenance event happened somewhere. Every environmental condition exists in a zone. When you overlay all of this data on a spatial model, patterns emerge that asset-centric views hide.
The most common discovery: environmental root causes. Plants that map maintenance history spatially almost always find a zone where failure rates are 2-3x higher than the plant average. The cause is typically environmental: inadequate ventilation, excessive vibration from a nearby process, contaminated utilities, or temperature excursions. These root causes aren't visible in CMMS data because each work order describes a different symptom on a different machine.
The second most common discovery: maintenance resource allocation mismatches. When you plot technician response paths on a floor plan, you often find that the maintenance shop is located far from the highest-maintenance areas of the plant. Pre-staging tools and common parts near high-maintenance zones can cut response times by 30-40% with zero additional headcount.
Teams using spatial maintenance analysis report that root cause investigations complete 40-60% faster because the spatial view immediately generates hypotheses that would take hours to develop from tabular data alone. The speed advantage compounds over time as historical spatial data accumulates and patterns become more statistically significant.
FAQ
Frequently Asked Questions
Related Resources
Manufacturing Downtime Cost Calculator
Calculate the true cost of unplanned downtime across your production lines. Includes lost revenue, labor waste, and scrap costs. Free, instant results.
Learn moreDigital Twin vs SCADA
A practical comparison of SCADA and digital twin platforms for manufacturing. Covers data models, visualization, alerting, and deployment trade-offs.
Learn moreDigital Twin vs MES
A practical comparison of MES and digital twin platforms for manufacturing. Covers ISA-95 levels, OEE tracking, production traceability, and how the two systems complement each other.
Learn moreUnplanned Downtime Prevention
Most manufacturers discover downtime after it costs them. Sandhed gives you the visibility to catch equipment issues before they shut down production.
Learn moreMaintenance Management
Maintenance teams lose hours tracking down service records, chasing overdue tasks, and figuring out what was done last time. Sandhed puts every work order, service record, and maintenance schedule on your 3D floor plan where you can see it.
Learn moreWhy Does My Production Line Keep Stopping?
Most unplanned stops come from a short list of causes that compound each other. Sensor blind spots, delayed maintenance response, equipment running past rated cycles, power quality events, raw material drift, PLC faults, and shift-change errors account for the majority of lost production time. Fixing them requires data correlation, not more dashboards.
Learn moreHow to Improve OEE: The 5 Levers That Actually Move the Number
OEE is the product of availability, performance, and quality. Most plants know their OEE number but can't pinpoint which of the three factors is dragging it down or why. Improving OEE requires decomposing the score, finding hidden losses in each category, and connecting production data to spatial context so you can see where on the floor the problems actually live.
Learn moreSources
- Reliability Engineering & System Safety — Pareto Analysis of Unplanned Downtime in Discrete Manufacturing
- Plant Engineering — Maintenance Survey: Shift to Cloud (2022 data, published 2023)
- Mobius Institute — Condition Monitoring Training & Certification (ISO 18436-2)
- Plant Services — Kits: Organized Maintenance in a Box (Spare Parts & MTTR)
- SMRP — Best Practices, Metrics & Guidelines (6th Edition)
Find Your Downtime Patterns Faster
Map your maintenance history onto your actual floor plan and see spatial patterns that CMMS spreadsheets miss. Walk through it with your own data.