Why Does My Production Line Keep Stopping?
Most unplanned stops come from a short list of causes that compound each other. Sensor blind spots, delayed maintenance response, equipment running past rated cycles, power quality events, raw material drift, PLC faults, and shift-change errors account for the majority of lost production time. Fixing them requires data correlation, not more dashboards.
1. Sensor Blind Spots
About 23% of unplanned stops [1] trace back to sensors that weren't monitoring the right parameter. Vibration on a gearbox bearing, temperature on a motor winding that was never wired to the PLC. You can't catch a failure mode you aren't measuring. Most plants discover these gaps only after a post-mortem.
The typical line has dozens of sensors, but they were installed based on the OEM's default I/O list. That list covers the obvious stuff: main drive current, hydraulic pressure, discharge temperature. It rarely covers secondary failure modes.
Consider a gearbox on a conveyor drive. The OEM monitors oil temperature and output speed. But the most common failure mode for that gearbox is bearing wear on the input shaft. Without a vibration sensor on that bearing housing, the first sign of trouble is a seized bearing and a dead line.
The fix isn't buying more sensors blindly. Walk your downtime Pareto. Pull the last 12 months of unplanned stops. For each one, ask: was there a sensor that could have caught this 30 minutes earlier? If not, that's a blind spot.
Common blind spots we see repeatedly:
- Motor winding temperature on auxiliary drives (not just the main spindle)
- Vibration on gearbox input bearings (not just output)
- Pressure differential across filters that get changed on a calendar, not on condition
- Ambient temperature near VFDs in enclosed panels
Retrofitting a wireless vibration sensor costs $200-400 per point. Compare that to the cost of one unplanned stop. The math usually takes about five seconds.
2. Delayed Maintenance Response
The average time between failure detection and wrench-on-machine is 47 minutes in plants without mobile alerts [2]. Work orders sit in a queue. Techs don't know which machine triggered the alarm or what parts to bring. Half the downtime is just logistics, not repair.
A sensor catches a fault. The PLC throws an alarm. The operator calls maintenance. The maintenance coordinator checks the board, assigns a tech, and the tech walks to the crib for parts. That chain is where 47 minutes disappear on average in plants without mobile dispatch.
Break that down. The alarm-to-call step takes 3-5 minutes because the operator tries a restart first. The call-to-dispatch step takes 8-15 minutes because the coordinator is handling three other requests. The dispatch-to-arrival step takes another 10-20 minutes because the tech has to figure out which machine, pull up the manual, and grab parts.
The actual repair? Often under 15 minutes.
Plants that cut response time in half typically do three things. First, they send alarms directly to the assigned tech's phone with machine ID, fault code, and location. Second, they pre-stage common spare parts at the line instead of in a central crib. Third, they attach a short troubleshooting checklist to each alarm code so the tech arrives with a plan.
None of this requires new technology. It requires changing the information flow so the right person gets the right context immediately. A CMMS with mobile push notifications handles most of it. The bottleneck is almost never the repair skill. It's the time spent figuring out what happened and where.

3. Equipment Running Past Rated Cycles
OEMs rate servo motors for roughly 20,000 hours [3]. Plants routinely run them to 28,000 or more. Cycle count tracking lives in a spreadsheet, if it exists at all. When a servo fails at 26,000 hours, it's not a surprise. It's a predictable event that nobody was tracking.
Every rotating component has a rated life. Servo motors, spindle bearings, ball screws, pneumatic cylinders. OEMs publish these numbers, but they end up in a binder on a shelf.
The problem isn't that plants ignore maintenance. It's that hour-based or cycle-based replacement intervals aren't connected to the actual running hours of the machine. A press that runs two shifts accumulates hours twice as fast as the same press on one shift. The calendar-based PM schedule treats them the same.
Here's what typically happens. A servo motor rated for 20,000 hours is installed. The PM schedule says "replace every 3 years," which assumes single-shift operation. The plant adds a second shift six months later. Nobody updates the PM interval. The motor hits 28,000 hours in 2.5 years and fails.
The fix is tracking actual run hours per component, not per machine. Most PLCs already count cycles or run hours internally. The data is there. It's just not connected to the maintenance system.
Start with your top 10 downtime contributors. For each one, find the rated life of the wear components. Compare that to the actual accumulated hours. You'll likely find several components running 30-40% past their rated life. Those are your next unplanned stops.
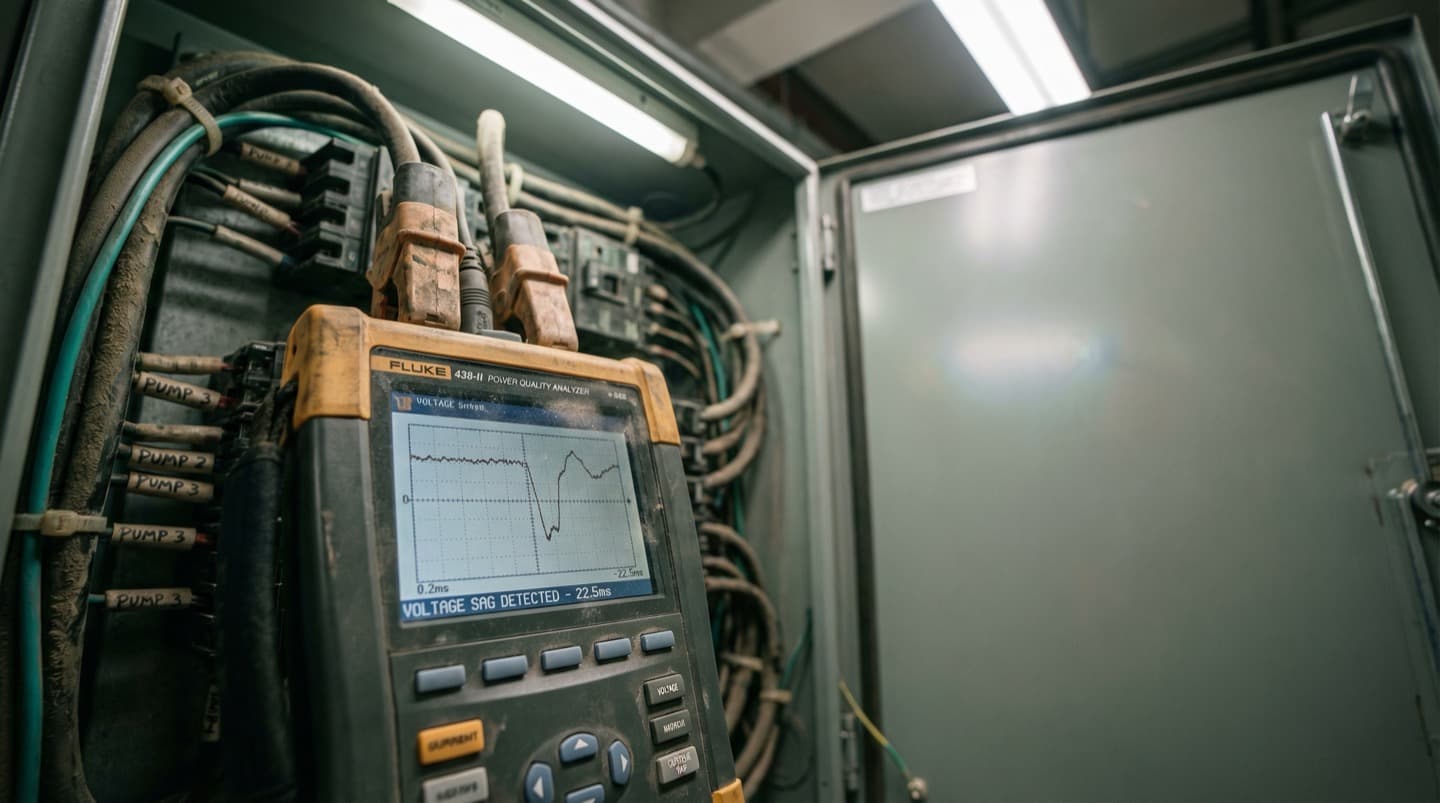
4. Power Quality Issues
Voltage sags below 90% of nominal cause VFDs to trip. Most plants experience 5-12 sag events per month [4]. The line faults, the operator restarts, and nobody logs the root cause. Without power quality monitoring at the panel level, these events look like random stops.
Variable frequency drives are sensitive to input power quality. A voltage sag to 85% of nominal for even 100 milliseconds can cause a DC bus undervoltage fault. The drive trips, the motor stops, the line goes down.
The frustrating part is that these events are intermittent and hard to reproduce. The operator sees a drive fault, resets it, and the line runs fine for hours. It looks random. But if you install a power quality meter on the incoming feed, you'll often find a pattern.
Common sources of voltage sags:
- Large motors starting on other feeders in the same plant
- Utility switching events (capacitor banks, tap changers)
- Welding operations on shared circuits
- Compressor starts without soft starters
Plants with 5-12 sag events per month lose 30-90 minutes of production time per event when you include the restart sequence, quality checks, and re-establishing steady state.
Power quality meters at the main distribution panel cost $2,000-5,000 installed. They log every sag, swell, and transient with a timestamp. Once you have that data, you can correlate drive faults with power events. The fix might be as simple as adding a DC bus reactor to the VFD, installing a ride-through module, or moving a welding circuit to a different feeder.
Without the data, you're chasing ghosts.
5. Raw Material Variability
Incoming material properties like moisture content, viscosity, and particle size drift between batches and sometimes within a batch. If you're not correlating material lot numbers with line speed and reject rates, you won't see the pattern. The line looks unreliable, but the real variable is the feedstock.
A packaging line runs perfectly for three days, then suddenly starts jamming every 20 minutes. The maintenance team checks everything mechanical. Nothing is wrong. Then the material lot changes and the problem disappears.
This pattern is common in food and beverage, pharma, plastics, and any process where raw material properties matter. Film thickness varies by 5-10 microns between rolls. Resin melt flow index shifts between suppliers. Powder moisture content changes with warehouse humidity.
The line was tuned for a specific material spec. When the material drifts, the line parameters are no longer optimal. But because the material change isn't tracked alongside machine performance, nobody connects the two.
What helps:
- Log material lot numbers against production runs in your MES or even a shared spreadsheet.
- Track incoming material certificates of analysis. Note the actual values, not just pass/fail against spec.
- When you get a run of stoppages, check if the material lot changed in the last 2-4 hours.
- Build a simple scatter plot of reject rate vs. key material properties over 30 days.
You'll often find that 80% of your "random" stops correlate with material lots from specific suppliers or specific property ranges. That's actionable. You can tighten incoming specs, adjust line parameters per material batch, or set up automatic recipe changes based on incoming test results.
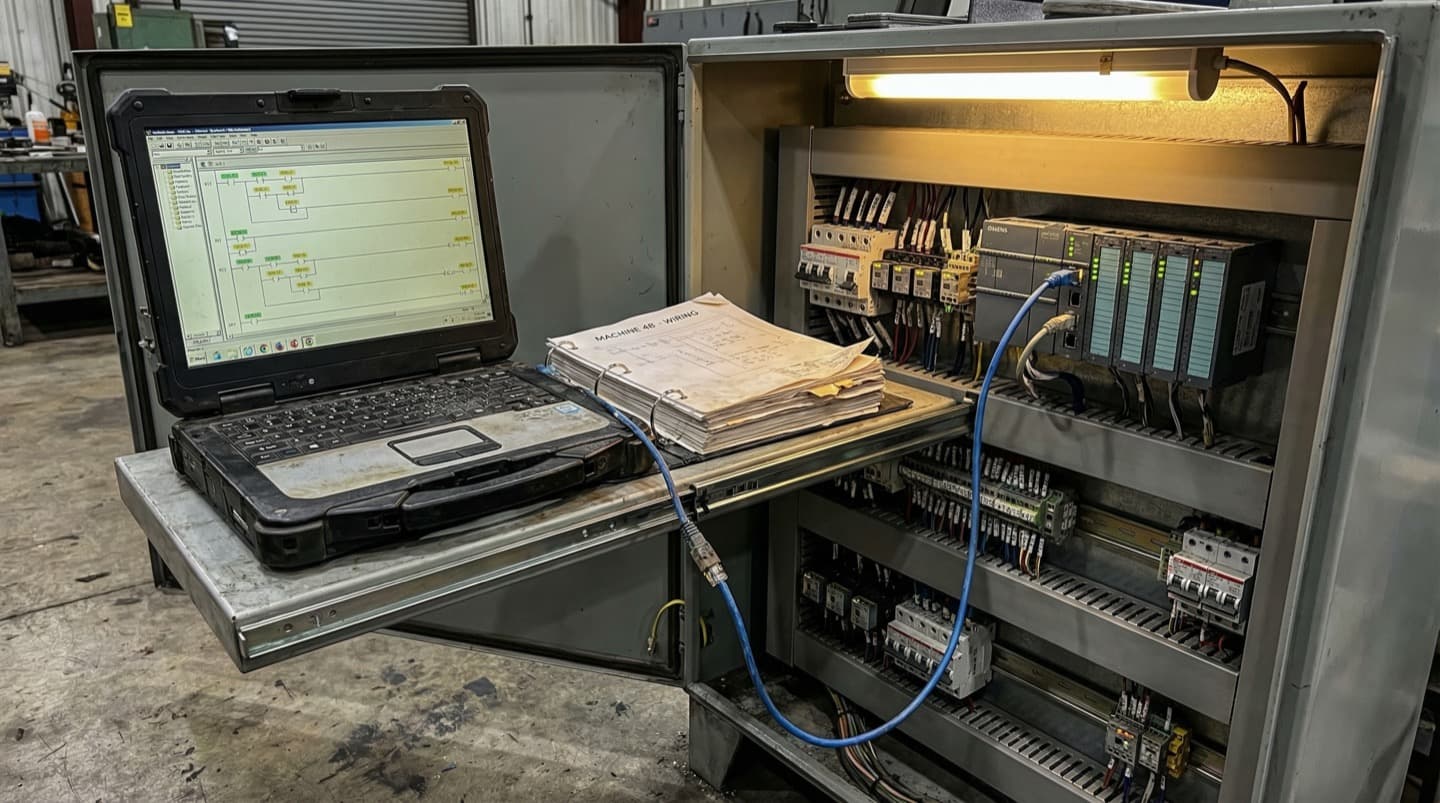
6. PLC and Software Faults
PLC firmware updates, HMI patches, and recipe changes introduce faults that are hard to trace. One wrong timer value and the line faults every 200 cycles. Software changes aren't always version-controlled or documented. The machine ran fine yesterday because yesterday's code was different.
A production line starts faulting intermittently. The alarm log shows a sequence timeout on station 4. Maintenance checks the mechanical components. Everything looks fine. The real cause? Someone adjusted a timer value in the PLC program last Tuesday to fix a different issue, and it created a race condition that only triggers at high cycle rates.
This happens more than most plants admit. PLC code is often modified by multiple people: the OEM's integrator, the plant's controls engineer, the third-party contractor who added the new vision system. Changes are made online, sometimes without saving the project file. There's no diff, no commit log, no rollback path.
Common software-related stoppages:
- Timer values changed to fix one issue that create a fault in a different sequence
- Recipe parameters uploaded from an old backup that don't match current tooling
- HMI firmware updates that change the behavior of communication drivers
- Safety PLC logic changes that alter the restart sequence timing
The fix is basic version control discipline. Save the PLC project file after every change. Use a naming convention with dates. Better yet, use PLC version control software that diffs ladder logic and function blocks.
Before any software change goes live, document what changed, why, and what the rollback steps are. When the line starts faulting, the first question should be: did anyone touch the code in the last 48 hours?
7. Operator Errors During Shift Changes
68% of plants report higher scrap rates [5] in the first 30 minutes after a shift change. Outgoing operators don't always pass along machine quirks, active alarms, or parameter adjustments they made during their shift. The incoming crew starts cold, and the line pays for it.
Shift handoffs are a known risk. The data confirms it. Plants that track scrap and downtime by time of day consistently see spikes in the first 30 minutes after a shift transition. The pattern is predictable, but most plants treat it as unavoidable.
What goes wrong during handoffs:
- The outgoing operator adjusted a temperature setpoint 2 degrees up to compensate for a material batch. They didn't mention it. The incoming operator sees the non-standard setpoint and changes it back.
- A machine had an intermittent fault that the outgoing operator learned to work around. The incoming operator doesn't know the workaround and calls maintenance.
- The outgoing operator ran the last 30 minutes of their shift at reduced speed to avoid a known jam point. The incoming operator starts at full speed.
Plants that reduce shift-change losses do it with structured handoff procedures. Not a clipboard that nobody reads. A 5-minute standing meeting at the machine with both operators present.
The handoff should cover three things: what's different from standard right now, what problems came up and how they were handled, and what's queued for the next shift. Some plants use a digital shift log displayed on the HMI. Others use a whiteboard at the line. The format matters less than the habit.
One approach that works well: the incoming operator shadows the outgoing operator for 10 minutes before the official shift change. They run the machine together. Problems that would have taken 20 minutes to diagnose take 2 minutes because the context is right there.
What Modern Teams Do Differently
Plants that cut unplanned downtime by 30% or more share a common approach. They layer spatial context on top of sensor data using digital twin technology. Instead of monitoring individual data points in isolation, they correlate machine state, environmental conditions, and material data in a single visual model.
Traditional monitoring gives you time-series charts on a screen. You see that motor 7 hit 85°C at 2:14 PM. What you don't see is that motor 7 sits next to a steam line that was leaking, in a corner of the plant where airflow is restricted, during a shift that was running 10% above target speed.
Digital twin platforms solve this by mapping sensor data onto a spatial model of the production floor. Every sensor has a location. Every machine has neighbors. Every environmental factor has a zone of influence.
This spatial correlation catches patterns that flat dashboards miss. When a VFD trips, the digital twin shows you that three other VFDs in the same electrical panel have been trending warm for a week. A traditional alarm system treats each drive independently.
The approach works because manufacturing problems are rarely isolated. A stopping event on one machine is usually the visible symptom of a system-level issue involving power, environment, material, and operating parameters interacting. Seeing those interactions requires a model that preserves spatial relationships.
Teams using digital twins for root cause analysis report finding the actual cause of chronic stops 40-60% faster than teams working from alarm logs [6] and spreadsheets alone. The speed comes from being able to visually trace upstream and downstream effects without walking the floor for every investigation.
The tooling has caught up in the last two years. What used to require months of modeling and custom development can now be deployed in days using floor plan imports and automated sensor mapping. The barrier for most plants isn't cost or complexity. It's awareness that the category exists.
FAQ
Frequently Asked Questions
Related Resources
Manufacturing Downtime Cost Calculator
Calculate the true cost of unplanned downtime across your production lines. Includes lost revenue, labor waste, and scrap costs. Free, instant results.
Learn moreDigital Twin vs SCADA
A practical comparison of SCADA and digital twin platforms for manufacturing. Covers data models, visualization, alerting, and deployment trade-offs.
Learn moreDigital Twin vs MES
A practical comparison of MES and digital twin platforms for manufacturing. Covers ISA-95 levels, OEE tracking, production traceability, and how the two systems complement each other.
Learn moreUnplanned Downtime Prevention
Most manufacturers discover downtime after it costs them. Sandhed gives you the visibility to catch equipment issues before they shut down production.
Learn moreMaintenance Management
Maintenance teams lose hours tracking down service records, chasing overdue tasks, and figuring out what was done last time. Sandhed puts every work order, service record, and maintenance schedule on your 3D floor plan where you can see it.
Learn moreHow to Reduce Equipment Downtime: 8 Strategies Ranked by Impact
Reducing equipment downtime starts with knowing where you're losing time, not with buying technology. The eight strategies below are ranked by how much downtime they typically eliminate in the first year. The top three are organizational fixes that cost almost nothing. The rest require incremental investment but build on each other.
Learn moreHow to Monitor a Factory Floor in Real Time
Real-time factory monitoring means having sensor data from machines, environment, and process parameters available within seconds, not hours. It starts with choosing the right sensors for your top failure modes, runs through an edge-to-cloud architecture that handles the data volume, and works only if the alert design respects your operators' attention.
Learn moreSources
- Plant Engineering Magazine — 2023 Maintenance Survey: Root Causes of Unplanned Downtime
- Reliable Plant — Mean Time To Repair (MTTR) Explained
- General OEM Specifications — Servo Motor Rated Life Hours (Industry Standard)
- Electric Power Research Institute (EPRI) — Power Quality Survey: Voltage Sag Frequency in Industrial Facilities
- IndustryWeek / Plant Engineering — Shift Handover Impact on Quality and Scrap Rates
- McKinsey & Company — Digital Twins in Manufacturing: Accelerating Root Cause Analysis
- Aberdeen Group — The Cost of Downtime in Automotive Manufacturing
Stop Guessing Why Your Lines Go Down
See how spatial sensor correlation finds the root causes that alarm logs miss. Get a walkthrough with your own floor plan data.