Hvad er en digital tvilling?
En digital tvilling er en virtuel repræsentation af et fysisk aktiv, en proces eller et system, der holdes synkroniseret med sin fysiske modpart via live sensordata. I modsætning til en statisk 3D-model trækker den løbende driftsdata ind, så teams kan se, hvad der sker på fabriks- eller lagergulvet, uden at være fysisk til stede.
1. Hvad er en digital tvilling?
En digital tvilling er en levende virtuel kopi af noget fysisk. Den afspejler tilstanden af en maskine, en produktionslinje eller en hel fabrik ved løbende at trække sensordata ind. I modsætning til en statisk CAD-model eller en engangssimulering opdaterer en digital tvilling sig selv, efterhånden som forholdene ændrer sig.
Konceptet stammer fra NASAs Apollo-program i 1960'erne. Missionskontrol vedligeholdt fysiske kopier af rumfartøjets systemer på jorden, opdateret med telemetri fra kredsløb. Ingeniørerne brugte disse kopier til at diagnosticere problemer og teste løsninger, før de sendte instruktioner til besætningen. Selve termen "digital twin" blev formaliseret af Dr. Michael Grieves ved University of Michigan i 2002, men den underliggende idé er ældre, end de fleste er klar over.
I dag er en digital tvilling et softwarekonstrukt. Den tager en rumlig model af et fysisk objekt og binder den til realtidsdatastrømme fra sensorer monteret på det objekt. Resultatet er en repræsentation, der afspejler aktivets aktuelle tilstand: temperatur, vibration, gennemløb, position, energiforbrug eller enhver anden målbar parameter.
Der er tre almindeligt anerkendte typer. En produkttvilling modellerer et enkelt aktiv, f.eks. en CNC-maskine eller en kompressor. En procestvilling modellerer et workflow, f.eks. en samlelinje eller en pakkesekvens. En systemtvilling modellerer en hel facilitet og forbinder flere aktiver og processer i ét samlet overblik. De fleste implementeringer i produktion starter med produkttvillinger og udvider derfra.
Den vigtigste forskel: en digital tvilling er ikke en simulering. En simulering bruger en model til at forudsige, hvad der kan ske under hypotetiske forhold. En digital tvilling viser, hvad der sker lige nu, baseret på faktiske data. De to supplerer hinanden. Man kan køre simuleringer oven på en digital tvilling, men selve tvillingen er forankret i målt virkelighed [1].
2. Sådan fungerer digitale tvillinger
Datapipelinen bag en digital tvilling har fem faser: fysiske sensorer indsamler målinger, edge-enheder aggregerer og sender data, en platform indlæser og mapper dem til en rumlig model, modellen renderer en live visualisering, og et analyselag markerer mønstre og anomalier på tværs af de kombinerede data.
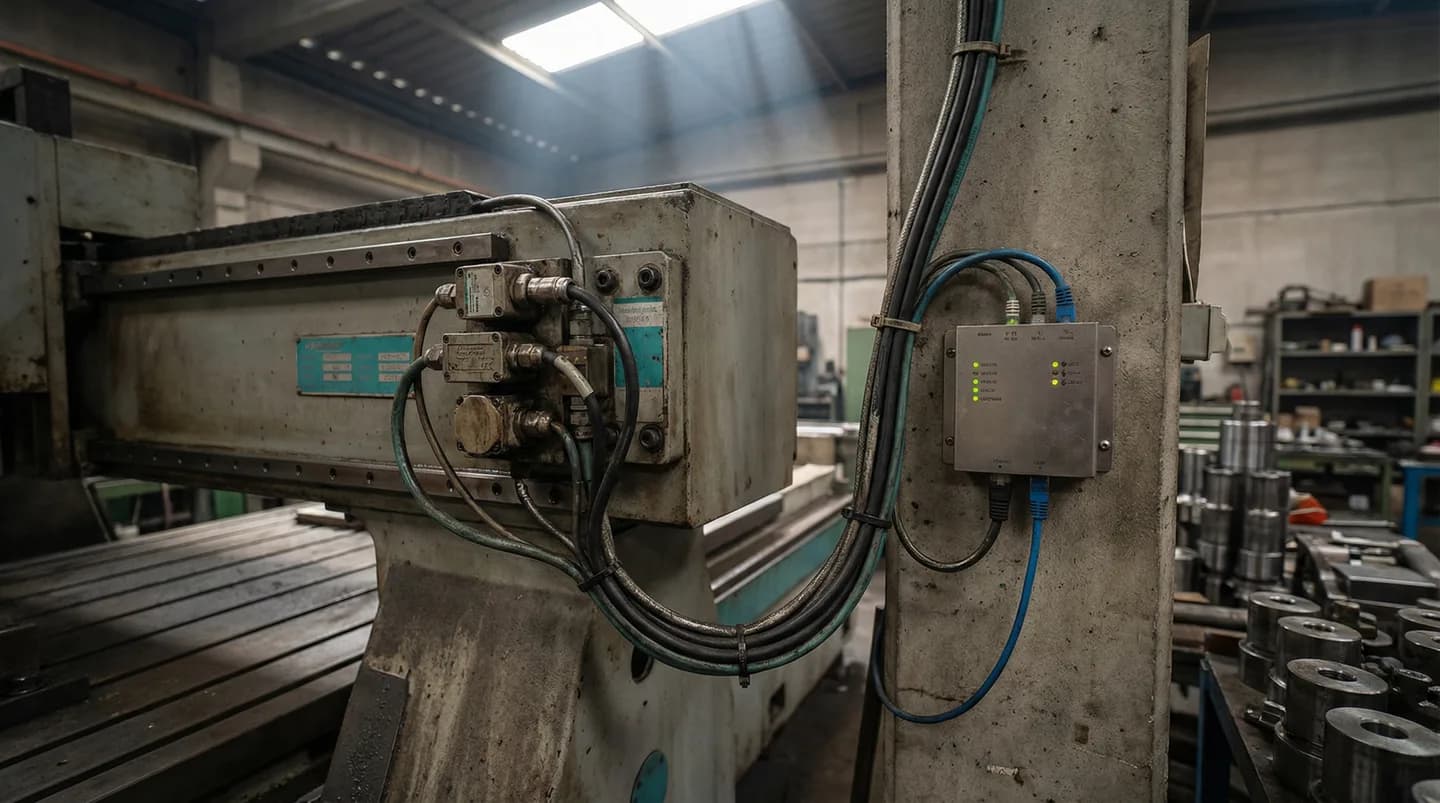
Start ved det fysiske lag. Sensorer monteret på udstyr måler parametre som temperatur, vibration, luftfugtighed, strømtræk, cyklustæller og position. Disse sensorer kommunikerer via industrielle protokoller: OPC UA til PLC'er og SCADA-systemer, MQTT til lette IoT-enheder, Modbus til ældre udstyr og REST API'er til cloud-forbundet udstyr. En enkelt produktionslinje kan generere data fra 50 til 200 sensorpunkter.
Edge gateways sidder mellem sensorerne og skyen. De opsamler rå datastrømme, anvender grundlæggende filtrering (fjerner støj, håndterer dubletter, buffer under netværksudfald) og videresender de rensede data til digital twin-platformen. Edge-behandling er vigtig, fordi det er dyrt og unødvendigt at sende hver rå sensoraflæsning til skyen. En vibrationssensor, der sampler ved 10 kHz, genererer gigabytes pr. dag. Edge-gatewayen udtrækker de relevante features, f.eks. spidsamplitude og dominerende frekvens, og sender kilobytes i stedet.
Platformlaget modtager disse data og mapper hver strøm til en placering i den rumlige model. Når en temperatursensor på motor 7 rapporterer 82 grader C, ved platformen, at motor 7 står i felt 3 i bygning A, og den opdaterer den visuelle repræsentation på den placering. Denne rumlige binding er det, der adskiller en digital tvilling fra et dashboard. Et dashboard viser dig et tal. En digital tvilling viser dig det tal i konteksten af, hvor aktivet er placeret, hvad der er ved siden af, og hvad der ellers foregår i samme zone.
Visualiseringslaget renderer dette som en interaktiv 3D- eller 2.5D-model, som brugerne kan navigere i. Teams kan zoome ind på en bestemt maskine, panorere hen over gulvet eller hente et heatmap på zoneniveau. Farvekodning indikerer status: grøn for normal drift, gul for advarselstærskler, rød for alarmtilstande.
Oven på visualiseringen sidder et analyselag. Det er her, mønstergenkendelse, tærskelalarmer og trendanalyse finder sted. Analyselaget kan korrelere data på tværs af flere sensorer og markere forhold, som ingen enkelt sensor ville fange alene. For eksempel er en motor, der kører varmt, ikke alarmerende i sig selv. Men en motor, der kører varmt, mens det tilstødende kølesystem også er stigende, og den omgivende zonetemperatur er forhøjet, peger på et ventilationsproblem, der påvirker hele området [2].
3. Digitale tvillinger i produktion
Produktion er det største adoptionsområde for digitale tvillinger. De mest almindelige anvendelser omfatter realtids produktionsovervågning, OEE-sporing, prædiktiv vedligeholdelse og energistyring. NIST-forskning viser, at digitale tvillinger kan generere op til 37,9 milliarder dollars i årlige fordele for den amerikanske produktionssektor.
Produktionsovervågning er indgangspunktet for de fleste producenter. En digital tvilling mapper hver maskine på gulvet til et live rumligt overblik. Operatører og driftsledere ser med et blik, hvilke linjer der kører, hvilke der er stoppet, og hvilke der er i advarselstilstand. Det erstatter praksis med at gå rundt på gulvet eller ringe til operatører for statusopdateringer. NIST estimerer, at digitale tvillinger kan generere op til 37,9 milliarder dollars i årlige fordele for amerikanske producenter gennem forbedret overvågning, reduceret nedetid og optimeret drift [2].
OEE-sporing bliver rumlig, når den kobles til en digital tvilling. I stedet for et OEE-tal i et regneark ser du, hvor tilgængeligheds-, ydelses- og kvalitetstab er koncentreret på gulvet. En zone med tre maskiner, der alle viser lave ydelsesscores, peger på en fælles grundårsag, måske et materialetilførselsproblem eller en miljøfaktor, som en maskinspecifik OEE-rapport ikke ville afsløre.
Prædiktiv vedligeholdelse er der, hvor digitale tvillinger leverer den tydeligste ROI. Ved at korrelere vibrationstendenser, temperaturprofiler og cyklustæller i rumlig kontekst kan teams identificere svigtende komponenter, før de forårsager uplanlagte stop. Den rumlige dimension gør en forskel her. Når ét leje på en transportbåndslinje begynder at degradere, kan den digitale tvilling vise, om tilstødende lejer følger samme tendens, hvilket indikerer et systemisk problem som fejljustering eller overbelastning snarere end en isoleret komponentfejl.
Energistyring drager fordel af den samme rumlige tilgang. En digital tvilling mapper energiforbrug til fysiske zoner. Du kan se, at bygning B bruger 40 % mere energi pr. outputenhed end bygning A, og derefter dykke ned i zonedata for at finde det specifikke udstyr eller de miljøfaktorer, der driver forskellen. Deloitte estimerer, at digitale tvillinger anvendt til energioptimering reducerer forbruget med 10-15 % i typiske produktionsfaciliteter [3].
Alle disse anvendelser handler om det samme: individuelle datapunkter er mere nyttige, når du kan se, hvor de kommer fra, og hvad der ellers sker i nærheden.
4. Digitale tvillinger i lagerstyring og logistik
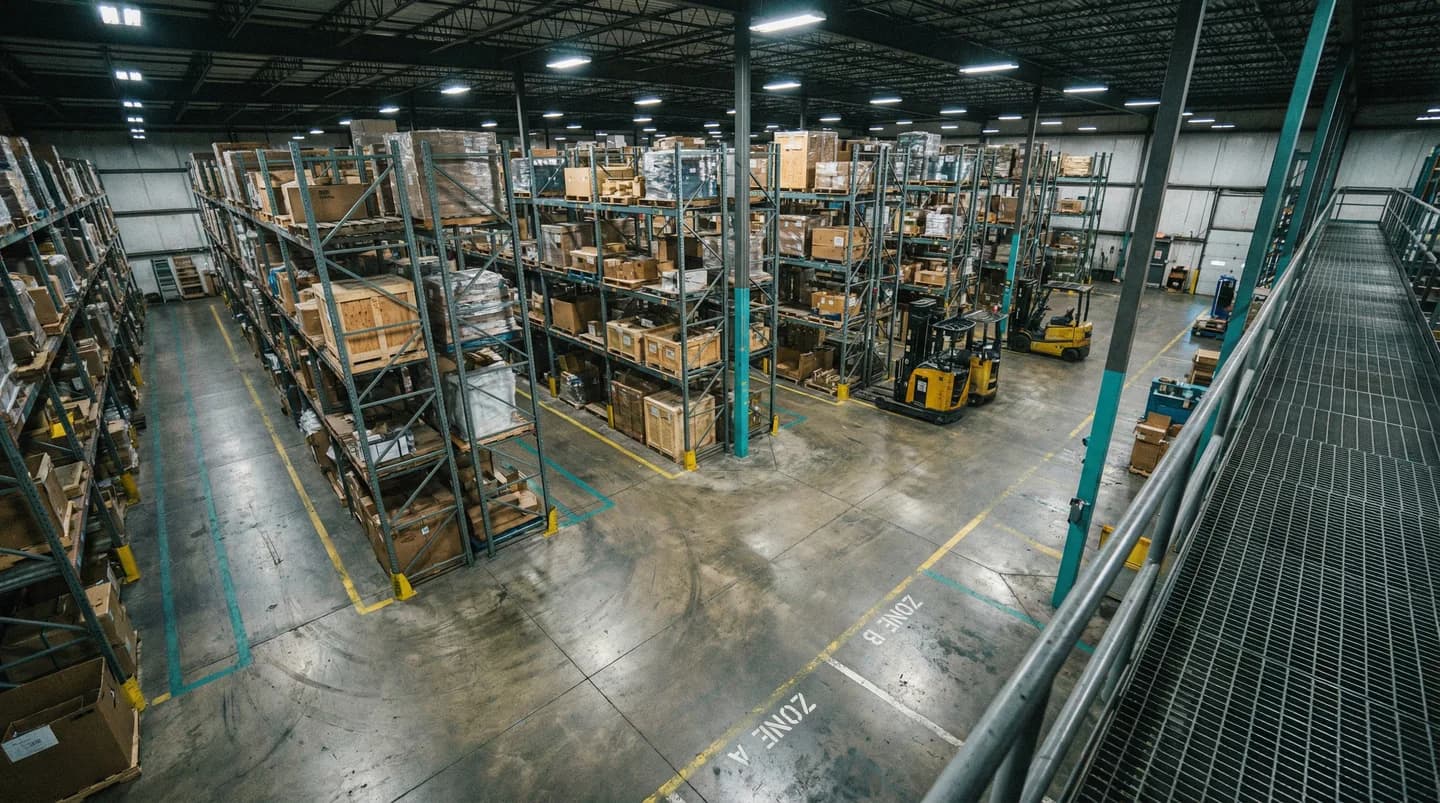
Lagre bruger digitale tvillinger til aktivsporing, visualisering af lagertæthed og portadministration. Værdien ligger i at se lagerets fysiske tilstand i realtid, hvilket lukker hullet mellem, hvad WMS'et siger, og hvad der faktisk foregår på gulvet.
Warehouse Management Systems sporer lagerbeholdning på transaktionsniveau. De ved, at palle X blev scannet ind på lokation Y på et bestemt tidspunkt. Men mellem scanningshændelser er WMS'et blindt for den fysiske virkelighed. Paller flyttes uden scanning. Delplukning sker uden systemopdateringer. Cyklusoptællinger afslører afvigelser, der har hobet sig op over dage eller uger.
En digital tvilling lukker dette hul ved at lægge sensorbaseret lokationssporing oven på lagerets plantegning. Ved hjælp af BLE-beacons, UWB-tags eller overliggende visionssystemer opretholder tvillingen et kontinuerligt billede af, hvor aktiver fysisk befinder sig. Når WMS'et siger, at en palle er i gang 7, felt 4, men sensorlaget viser, at den blev flyttet til staging for 20 minutter siden, dukker afvigelsen op med det samme i stedet for at vente på den næste cyklusoptælling.
Heatmaps over lagertæthed er et af de mest praktiske outputs. Zoner farvekodes efter fyldningsgrad: grøn under 70 %, gul ved 70-90 %, rød over 90 %. Modtagelsesteams bruger det til at omdirigere indkommende paller til åbne zoner, før trængsel opbygges. Driftsledere bruger det til at spotte dødt lager, der optager prime-placeringer, mens aktivt lager skubbes til mindre tilgængelige steder.
Portadministration fungerer på samme måde. En digital tvilling viser, hvilke porte der er optaget, hvilke lastbiler der bliver lastet eller losset, og hvor længe hver port har været i brug. Kombineret med data om indkommende forsendelser hjælper tvillingen logistikteams med at planlægge portfordelinger, så trailernes ventetid og truckernes køreafstand minimeres.
Samme idé som i produktion: den digitale tvilling tilføjer rumlig realtidskontekst, som transaktionsbaserede systemer aldrig var designet til at levere. Den erstatter ikke WMS'et. Den udfylder hullerne mellem scanningshændelser [4].
5. Digitale tvillinger vs. traditionel overvågning
Traditionelle overvågningsværktøjer som SCADA-skærme og flade dashboards viser data som tal, grafer og alarmlister. Digitale tvillinger tilføjer en rumlig dimension, der viser data i konteksten af, hvor de blev genereret. Denne rumlige kontekst afslører korrelationer og mønstre, som tabelvisninger overser.
Et SCADA-system viser dig, at pumpe 12 trækker 15 % mere strøm end sin baseline. Det er nyttig information. Men det fortæller dig ikke, at pumpe 12 står ved siden af en varmeveksler, der har kørt varmt i tre dage, i en sektion af anlægget, hvor to andre pumper viste den samme strømstigning sidste måned, før deres tætninger fejlede.
Traditionel overvågning er organiseret omkring udstyrshierarkier og alarmlister. Du ser data pr. aktiv, pr. tag, pr. alarmprioritet. Relationerne mellem aktiver er implicitte, gemt i operatørens erfaring. En erfaren operatør, der har arbejdet på det samme gulv i 20 år, bærer den rumlige viden i hovedet. En ny operatør gør ikke.
Digitale tvillinger gør rumlige relationer eksplicitte og visuelle. Når en VFD tripper, ser du ikke bare en alarmkode. Du ser VFD'en på plantegningen, dens naboer, den eltavle den er tilsluttet, og miljøforholdene i den zone. Hvis tre VFD'er i det samme tavleområde har trippet den seneste uge, er mønsteret synligt med det samme. I et traditionelt alarmsystem ville du skulle filtrere, sortere og korrelere manuelt for at se det samme mønster.
Det betyder mest for grundårsagsanalyse. Produktionsproblemer har sjældent isolerede årsager. En kvalitetsfejl på en fyldningslinje kan spores tilbage til en temperaturudsving, der spores tilbage til et kølesystemproblem, der spores tilbage til et tilstoppet filter i et teknikrum på den anden side af bygningen. Flade dashboards behandler hver af disse som separate datapunkter. En digital tvilling bevarer den fysiske kæde af årsag og virkning.
Platforme som Sandhed tager dette videre ved at lade teams importere eksisterende plantegninger og mappe sensorer på dem uden 3D-modelleringsekspertise. Plantegningen bliver grænsefladen. Du navigerer din facilitet visuelt, klikker på en zone eller et aktiv og ser dets live data og seneste tendenser. Det er en anden interaktionsmodel end at scrolle gennem en liste af tagnavne eller alarmkoder.
Pointen med rumlig overvågning er ikke æstetik. Det handler om at få den måde, du ser på data, til at matche den måde, din facilitet faktisk er indrettet. Produktion foregår i fysisk rum. Overvågningen bør afspejle det.
6. Kom i gang med digitale tvillinger
Du har brug for tre ting for at implementere en digital tvilling: en plantegning af din facilitet, sensorer på det udstyr, du vil overvåge, og netværksforbindelse til at flytte data. Moderne platforme håndterer 3D-renderingen automatisk ud fra 2D-plantegninger, så opsætningen er mindre omfattende, end det lyder.
Den største misforståelse om digitale tvillinger er, at de kræver måneders 3D-modellering, specialudviklet software og et dedikeret IT-team. Det var sandt for fem år siden. Det er det ikke i dag. Moderne digital twin-platforme som Sandhed lader dig uploade en 2D-plantegning, placere sensormarkører på den, forbinde dine datakilder og have et live rumligt overblik kørende inden for dage.
Her er, hvad du faktisk har brug for:
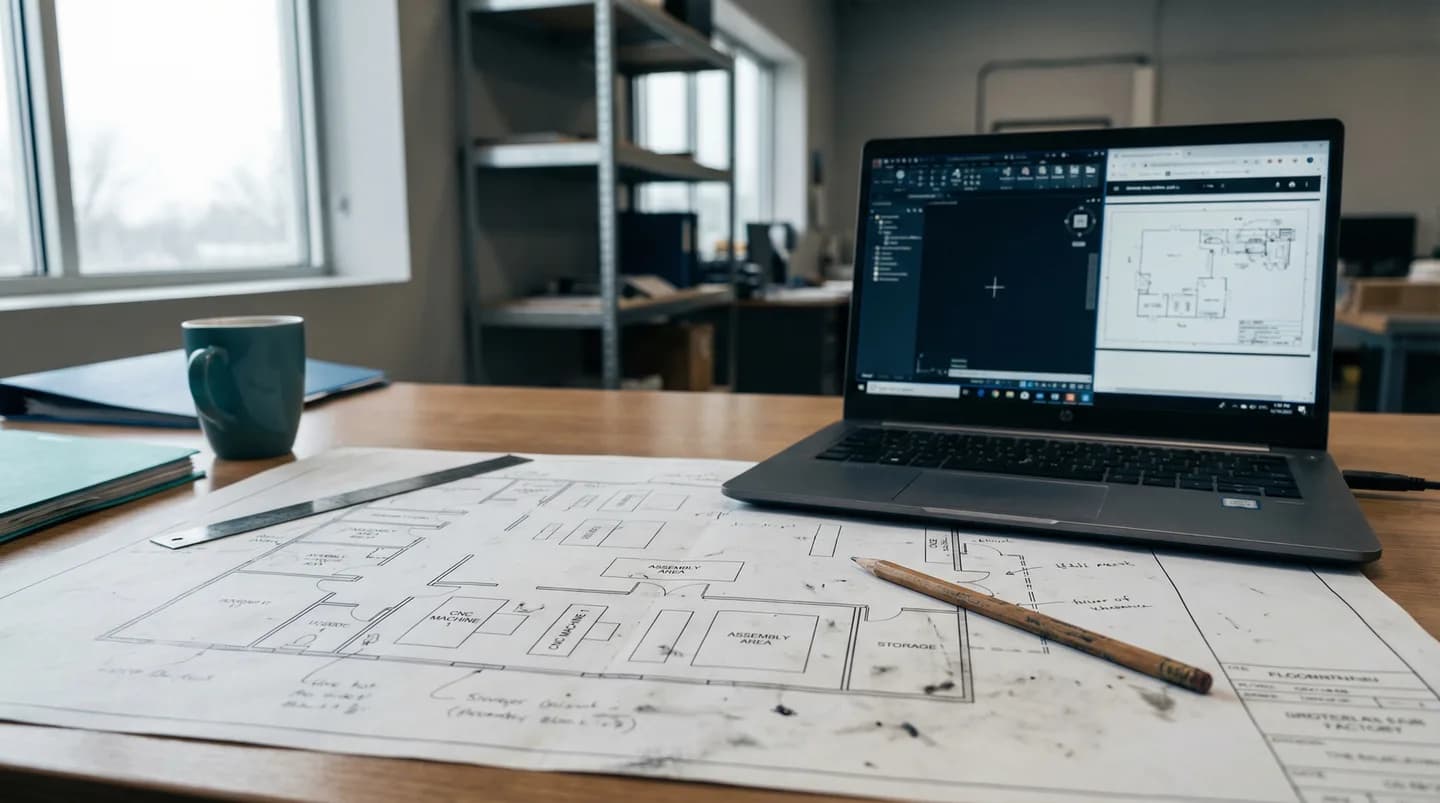
En plantegning. Det kan være en CAD-fil, en PDF-tegning eller endda et klart fotografi. Platformen bruger den som det rumlige fundament. Du behøver ikke en detaljeret 3D-model. En 2D-plan med korrekte mål er nok til at komme i gang.
Sensorer på dit udstyr. Hvis du allerede har sensorer, der sender data til et SCADA-system, en PLC eller en IoT-platform, har du sandsynligvis de data, du har brug for. Digital twin-platformen forbinder til disse eksisterende kilder via OPC UA, MQTT, REST API eller databaseforespørgsler. Du behøver ikke installere nye sensorer, medmindre du har blinde vinkler, du vil dække.
Netværksforbindelse. Sensordataene skal nå platformen. Ved on-premise-implementeringer betyder det, at dit fabriksnetværk kan route data fra edge-gatewayene til platformen. Ved cloud-implementeringer skal edge-enhederne have udgående internetadgang. De fleste moderne fabrikker har allerede denne infrastruktur på plads.
Almindelige misforståelser, der er værd at adressere: Du behøver ikke en fuld BIM-model. Du behøver ikke modellere hvert rør og kabelbakke. Du behøver ikke et dedikeret simuleringsteam. Du behøver ikke stoppe produktionen under implementeringen. Platformen er read-only. Den observerer og visualiserer. Den styrer eller ændrer ikke dit udstyr.
Realistiske tidslinjer varierer efter omfang. En enkelt produktionslinje med 20-50 sensorpunkter kan være live på 1-2 uger. Et fuldt fabriksgulv med flere linjer og miljøovervågning tager typisk 4-8 uger. En implementering på tværs af flere bygninger tager 2-4 måneder. Tidslinjen er domineret af sensorinstallation og datakilde-integration, ikke af opsætningen af selve platformen.
Start i det små. Vælg én linje eller én zone, hvor du har et aktivt problem, f.eks. tilbagevendende nedetid eller kvalitetsvariation. Implementér tvillingen der, bevis værdien, og udvid derfra. At forsøge at digitalisere en hel facilitet på dag ét er den mest almindelige årsag til, at digital twin-projekter går i stå [5].
Hvordan teams bruger digitale tvillinger i dag
De mest effektive digital twin-implementeringer starter smalt og udvider baseret på dokumenterede resultater. Teams vælger et specifikt problem, forbinder de relevante data og itererer. De platforme, der bliver hængende, er dem, der leverer værdi i de første to uger, ikke efter et seks måneders implementeringsprojekt.
Skiftet i digital twin-markedet over de seneste tre år har været fra store IT-projekter til målrettede driftsværktøjer. For fem år siden betød implementering af en digital tvilling, at man hyrede en systemintegrator, byggede en speciallavet 3D-model og brugte seks måneder på integration, før man så data på skærmen. De fleste af de projekter leverede imponerende demoer, men gik i stå, før de nåede daglig operationel brug.
Det, der virker nu, er anderledes. Teams starter med at importere en plantegning og forbinde deres eksisterende datakilder, PLC-feeds, IoT-sensorer, SCADA-historikere, i den første uge. De får et rumligt overblik over deres facilitet, der opdateres i realtid. Derfra tilføjer de lag: alarmtærskler, trendoverlejringer, zonebaseret rapportering.
Værdien viser sig hurtigt. Et vedligeholdelsesteam finder grundårsager hurtigere, fordi de kan se, hvad der ellers sker tæt på en fejl. En driftsleder spotter en flaskehals, der er ved at bygge sig op, før den forårsager tab. En kvalitetsingeniør opdager, at fejlrater klumper sig i en bestemt zone, og sporer det til en miljøfaktor. Det er ikke hypotetiske fordele; de opstår i de første ugers brug.
Adoption følger typisk et mønster. Ét team implementerer en tvilling til ét problem. Deres resultater er synlige for tilstødende teams. De teams beder om adgang. Inden for et par måneder bliver tvillingen den standardmåde, folk ser på faciliteten. Den erstatter vanen med at gå ned på gulvet for at tjekke tingene og vanen med at ringe til operatører for statusopdateringer.
Teknologien er moden nok til, at den største tilbageværende barriere er kendskab. Mange producenter overvåger stadig deres drift med værktøjer, der blev designet, før rumlig computing var praktisk muligt. De fleste fabrikker kunne implementere en digital tvilling i dag. De fleste har ikke prøvet.
FAQ
Ofte stillede spørgsmål
Relaterede ressourcer
Beregner for nedetidsomkostninger i produktion
Beregn de reelle omkostninger ved uplanlagt nedetid på dine produktionslinjer. Inkluderer tabt omsætning, lønspild og spildmaterialer. Gratis og med øjeblikkelige resultater.
Læs mereDigital twin vs SCADA
En praktisk sammenligning af SCADA og digital twin-platforme til produktion. Dækker datamodeller, visualisering, alarmer og implementering.
Læs mereDigital twin vs WMS
En praktisk sammenligning af warehouse management-systemer og digital twin-platforme. Dækker datamodeller, opdateringsfrekvens og read-only-integration.
Læs mereDigital Twin vs MES
En praktisk sammenligning af MES og digital twin-platforme til produktion. Dækker ISA-95-niveauer, OEE-sporing, produktionssporing og hvordan de to systemer supplerer hinanden.
Læs mereDigital twin vs ERP
Hvordan ERP-systemer og digital twin-platforme sammenlignes til produktion og lagerdrift. Dækker datamodeller, opdateringsfrekvens og hvor hvert system skaber værdi.
Læs mereDigital twin vs BMS
En praktisk sammenligning af BMS og digital twin-platforme til farmaceutiske, fødevare- og lagermiljøer. Dækker BACnet, ISO 50001 og cold chain-compliance.
Læs mereDigital Twin vs Dashboards
Sammenligning af industrielle dashboards og digital twins inden for datavisualisering, fejlfinding og overvågning på tværs af systemer. Dækker Grafana, Power BI og rumlige alternativer.
Læs mereForebyggelse af uplanlagt nedetid
De fleste producenter opdager nedetid, efter det har kostet dem. Sandhed giver jer synligheden til at fange udstyrsproblemer, før de lukker produktionen ned.
Læs mereSådan overvåger du en fabrikshal i realtid
Realtidsovervågning af en fabrikshal kræver mere end sensorer og dashboards. Du skal vælge de rigtige målepunkter, beslutte om data skal behandles på edge eller i cloud, designe alarmer der ikke giver træthed, og tænke miljøovervågning med fra starten. De fleste fabrikker starter med én produktionslinje og skalerer derfra.
Læs mereSådan får du maskindata i realtid uden et 6 måneders integrationsprojekt
Traditionelle maskinintegrationsprojekter tager lang tid, fordi de forsøger at løse alt på én gang: protokolkonvertering, datamodellering, sikkerhed, historik og visualisering. En hurtigere tilgang er at bruge edge gateways til at trække data ud af eksisterende maskiner, eftermontere sensorer på udstyr uden digitalt output og holde forbindelsen read-only. Fra første datapunkt til fuld fabriksdækning kan gå ned til uger i stedet for måneder.
Læs mereSe din facilitet som en live digital tvilling
Upload din plantegning og forbind dine sensordata. Få en gennemgang med dit eget facilitets layout.